


The biggest factor driving your financial health is your behavior — not just how you spend or save but also understanding where your money is going. Focus on these four key metrics.

Table of contents
Designing a financial plan that aligns your family’s values with your hard-earned money is important to almost everyone — especially attorneys. However, the most limited resource an attorney has is time.
If you’re a DIY investor, it can be difficult to find time to sift through blog posts, articles and podcasts. Not to mention, this isn’t the way most of us choose to spend a Saturday afternoon.
Perhaps you’ve considered engaging a professional financial planner only to find that the homework required is daunting: gathering tax returns, investment statements, insurance policies, your employee benefits handbook and so on. Or, you’ve managed to gather all the documents and have been asked to estimate what your vacation expenses and tuition costs will look like 15 years from now. Throw in some estimations around inflation and investment returns, and you are left with a nice … plan.
A plan that’s going to change.
I Love a Good Financial Plan, But …
Don’t get me wrong. This is a terrific exercise every attorney should do — especially as you near retirement. It gives you direction today.
But while I love a good plan, the only thing we know with certainty is that the plan will need to change. Because life changes. Jobs change. Tax law changes. Markets change. Desires change. Relationships change.
It’s the ability to make course corrections along the way that makes all the difference.
Get a Handle on Your Cash Flow
The common denominator driving your financial health is your behavior. That is, understanding where your money is going and why. It is hard to course-correct if you don’t have a handle on cash flow. So, let’s make things easier to track.

Very Simply, Your Money Falls Into Four Categories
- Savings
- Debt payments
- Tax Payments
- Spending
(Charitable giving may be itemized separately for some, but I tend to include that in spending.)
You may wonder if “spending” is too broad. After all, “spending” could mean just about anything. You might ask if there should be categories for spending. You know, like the ones that make you feel guilty about the $6 coffee you enjoy each morning? Maybe. For some.
But since time is your most limiting resource, I argue that if the other three areas — savings, debt and taxes — are managed appropriately, it doesn’t matter where you spend.
Stay with me; I’ll walk through how easy it can be to track and manage these categories.
Understanding Your Financial Baseline
If you’re not ready to engage with a professional or get down to the nitty-gritty of your cash flow on your own, there is a simpler way to identify a baseline in about 10 minutes — by tracking your financial vitals.
Let’s dive deeper into what the four cash flow “vital signs” should look like for an attorney.
Before we start, know that this exercise is not intended to be an exact science. Some lawyers will fall above and below these ranges. However, after working with clients over the last decade, I’ve noticed a pattern of healthy vitals we can measure to quickly assess an attorney’s current financial health.
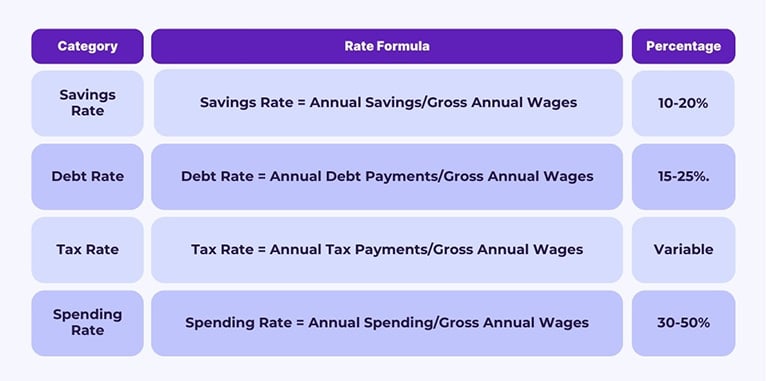
1. Savings Rate
Aim for 10%-20%.
Savings Rate = Annual Savings / Gross Annual Wages
For example, a family that is saving $20,000 per year on family wages of $200,000 would have a savings rate of 10%.
This number is easy to quantify: Grab a bank or investment statement and look at your “YTD contributions.” Savings include retirement accounts (401k, IRA, Roth IRA, etc.) and cash savings into checking, savings or money market accounts. I’ll take it one step further to add that the extra $300 you may be paying toward your mortgage each month could also be added here.
Why 10%-20%?
Families that save within this range give themselves the highest chance of replacing their current income in retirement. Variables such as employer match (if any), Social Security, pensions or other earned income in retirement may affect your specific range. But keep it simple if this is your first crack at this.
2. Debt Rate
Aim for 15%-25%.
Debt Rate = Annual Debt Payments / Gross Annual Wages
For instance, a family with $40,000 in annual debt payments on $200,000 family wages would have a 20% debt rate. Debt payments include mortgage, auto, credit card, personal loan, medical debt or any other liability.
Debt rates of 35%-50% hinder future savings, while 25%-35% are elevated and need monitoring. Ideal rates fall in the 0%-15% range, but consistently paying with cash may indicate missed wealth-building opportunities.
Banking guidelines may allow higher mortgage payments, but prudence is key to a healthy financial decision.
Keep in mind that these are not banking or lending guidelines. With a healthy profile, your bank will probably lend you enough money for a house that will leave you with a mortgage payment exceeding 35% of your annual wages or higher. But that doesn’t make it a healthy financial decision.
3. Tax Rate
Due to the many factors that affect tax rates, I simply recommend quantifying this amount and then looking for ways to improve it from there.
Tax Rate = Annual Tax Payments / Gross Annual Wages
Tax payments include federal, state and local taxes. They can easily be retrieved from your most recently filed tax return and are good enough for this estimate. If you’d like to get more detailed, you may want to add real estate taxes (unless you already included them in a mortgage escrow), school taxes, FICA taxes, etc. But again, I’d keep this simple.
Providing a healthy range for this category can be difficult. In any given year, asset sales, varied income, and certain tax planning strategies may affect your tax rate. So, quantify this rate as a baseline, and then begin looking at opportunities to tax plan. This may include more contributions to retirement accounts, identifying tax-deductible expenses within your business, or charitable giving strategies.
4. Spending Rate (or “Burn Rate”)
Aim for 30%-50%.
Spending Rate = Annual Spending / Gross Annual Wages
Once you’ve identified the appropriate rate for the first three categories you are left with your spending rate. This is the category that is the most time-consuming and difficult to quantify under a traditional budgeting approach.
By using this process of elimination method, however, you don’t have to identify every spending expense individually. If $6 coffees make you happy, why wouldn’t you buy them? Where I spend my extra cash doesn’t need to be where you spend yours.
Unless you are retired, elevated spending of 50%-70% may represent inadequate savings, higher debt rates and higher taxes. A lower spending rate of 15%-30% may represent a feeling of guilt around normal spending. It’s OK to spend! After all, that’s why most of us work.
Attorney Financial Planning: The Recap
Remember, these are estimates, not financial advice. Everyone’s situation is different.
The variables and uncertainties of financial planning keep most attorneys from taking action. You can simplify your cash flow management and improve your financial health by focusing on these four metrics.
Featured image licensed under the Unsplash+ License